The United Kingdom’s Office of National Statistics ONS, Current Price Input-Output Branch, provided the core of data needed for this study. The Annual Supply and Use Tables for the years 1992-2002 contained in their 2004 Edition Input-Output Analyses 1 were suited to the task because they had all been restated in terms of a consistent methodology so as to represent an ectype of economic activity from year to year.
SFEcon's input/output structure, having been defined by the operational needs of an emulation algorithm, is not a standard Leontief format. Translation of the ONS tables into the form required by SFEcon’s programs is therefore not a straightforward process: several decisions must be made for which there are worthwhile alternatives; and the input/output data require augmentation from unrelated sources. It can, however, be said that the requisite decisions were made with intelligence and applied consistently to all the data.
Where standard practice has national accounts presented in terms of a matrix of money flows, SFEcon presents economic activity in terms of physical flows accompanied by money prices. When computing the utility parameters UIJ for an input/output matrix EIJ that is denominated in money flows, it is appropriate to suppose 1) that all prices are unity, and 2) that physical flows happened to be denominated in whatever physical units of measure happen to validate those prices.
The matter becomes a bit more complicated in longitudinal studies because general price levels change with time, while the utility parameters to be traced through time are to be examined in terms of a necessarily constant physical unit. Fortunately, the SFEcon system offers further interpretations by which physical units can be altogether removed from the snapshot of a given economic moment. We need only interpret the Z parameter for the sector producing a commodity J as having a physical unit of 1. Utility parameters in column J are then normalized to UIJ/ZJ, which is dimensionless. Normalized utility parameters can be compared longitudinally if the data are initially conditioned to occur in a uniform currency by application of a consumer price index.2
It must be noted that SFEcon transposes a standard practice of input/output analysis by organizing data for sectors in rows, which has their intake of commodities appearing in columns. This appeals to the commonplace expectation that data stated in the same physical unit usually appears in columns for the sake of easily envisioning sums and remainders.
More familiar analysis has households, governments, etc., presented as the extrinsic driving forces by which economic change is effected. SFEcon attributes economic change to underlying changes in parameters describing productive technology, demographics, and culture that it quantifies through the premise of optimality. It therefore has the typical auxiliary variables of input/output analysis intrinsic to its matrix so as to reflect their competition for productive assets and their impact on commodity valuations.
Households’ product is taken to be leisure time; and the optimal rate of its production is that for which the values of the last hour of work equals that of the first hour of rest — all of which rather recalls Jevons. The ONS’ Population Estimates Unit provided the data on population and hours of remunerative work 3 needed to animate this concept. The MSWin Excel workbook in which these data are transformed into the population’s total hours of work and leisure is available for inspection here.
The shape of data available for this study also dictated enfolding the activities of government with households in computing their joint utility function: a representative government’s use of economic assets is therefore presumed to be as much the expression of human will as private purchases. Leisure time was brought into the matrix structure for this study at the household sector's diagonal element.
Imports and exports, by contrast, had to be shifted from intrinsic to extrinsic status on the ground that these ‘sectors’ have no underlying production functions. They are, rather, true categories of account expressing the operational consequences of actual producing sectors having rivals in the economic structures of other nations.
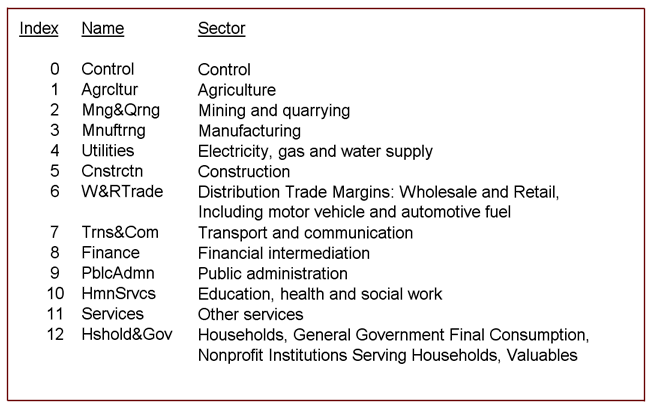
The transformations described above were executed in an MSWin Excel workbook for each of the eleven years from 1992-2002. The workbook for 1992 exhibits these calculations in detail. Ultimately, the study proceeded from a segmentation of the UK’s total economic activity into the twelve sectors set out in the table below.

Sectors in the Input/Output Structure
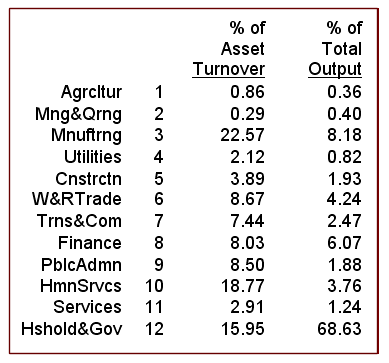
Workbooks summarizing primitive and transformed matrices for each year in the study can be accessed from here. And a workbook gathering all the EIJ and UIJ matrices prepared for this study is available here. The final segmentation of economic activity produced a widely varying spectrum of participations in the economic whole, as shown in the following tabulation of percentages of asset turnover and total output by sector.

Finally, it should be noted that four anomalies appeared in the eleven computations for
households’ use the mining and quarrying product. These four entries were negative owing to
various subsidies and instances of public support. As the mining and quarrying sector is so small
as to have virtually no impact anywhere in the system, no corrections were made for this technical
impossibility at any point in the ensuing calculations.
_____________________
1 UK Office of National Statistics; Annual Supply and Use Tables, GVA.
< http://www.statistics.gov.uk/about/methodology_by_theme/inputoutput >
described at: http://www.statistics.gov.uk/pdfdir/ukio0804.pdf
2 UK Office of National Statistics; Consumer Prices Index(CPI):
< http://www.statistics.gov.uk/StatBase/tsdataset.asp?vlnk=7174&More=Y >
3 UK Office of National Statistics; Population Estimates: 1992-2000 (revised):
< http://www.statistics.gov.uk/statbase/ssdataset.asp?vlnk=8601&More=Y >
2001 (revised):
< http://www.statistics.gov.uk/statbase/ssdataset.asp?vlnk=8524&More=Y >
2002 (revised):
< http://www.statistics.gov.uk/statbase/ssdataset.asp?vlnk=8535&More=Y >