Our article on constructing the demand schedules reported by Model 0 introduced a ‘ratio/sum technique’ by which to compute a weighted average for a group of ratios. The problem of estimating an equilibrium commodity price via simultaneous solution of supply and demand schedules provides the occasion for a full exposition of this technique.
Consider the case of three ratios that resolve to one and the same value, e.g.: 1:3, 4:12, and 6:18. Computing their central tendency by the ratio-sum method, i.e.:
(1 + 4 + 6)/(3 + 12 + 18) = 11/33 = .33333333
yields the ratio to which they are all equal. When all ratios resolve to the same value, any weighting function would produce this result.
Now imagine three ratios having values slightly at variance from 1:3. While we might define their central tendency using any simple or weighted average of their values, the ratio/sum method is likely to have application in price theory in that the 6:18 ratio’s variance will be given much more weight than the same variance in the 1:3 ratio.
Suppose the 1:3 ratio goes up 20%, the 4:12 ratio remains unchanged, and the 6:18 ratio goes down 20%. Using a simple average for the central tendency would yield no change from the example in which every ratio resolves to 1/3. Now consider that the ratio-sum method yields:
(1.2 + 4 + 4.8)/(3 + 12 + 18) = 10/33 = 0.3030303
Here the 20% decrease in 6:18 is automatically given more weight than the 20% increase in 1:3.
Using this technique to infer the central tendency among the marginal cost and marginal value equations referring to a given commodity assures that the result will favor the costs or values of the more financially powerful sectors, i.e.: those having the larger financial discriminant z. Price theory might therefore be enriched by accommodating the phenomenon of a single financially powerful user of good J essentially dictating J’s price to its producer; or the case of a powerful producer asserting the marginal cost of J’s production as the price to be accepted by an atomized market.
This process for estimating an equilibrium price might be usefully visualized in terms of the
slope of a ray emerging from the origin of a field defined by $/year versus physical units of
J/year. Each sector I’s value of marginal product ratio for
J, zI/(UIJ
+EIJ), would be expressed by a point
in this field, as would the ratio expressive of J’s marginal cost of
production
zJ/(ZJ
-YJ). The slope of our prospective price ray
would represent the ‘best visual fit’ among data points given by numerators and
denominators of the marginal cost and marginal value
equations:
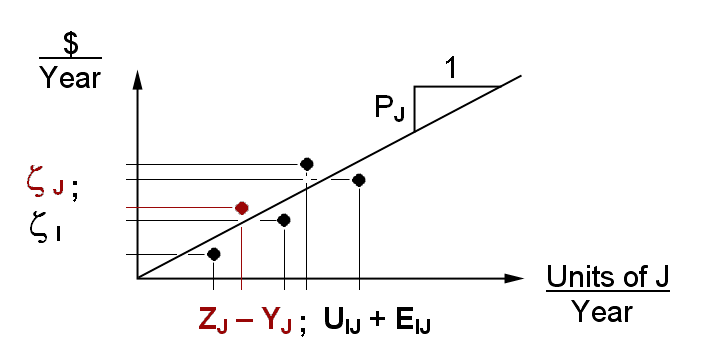
In this view the model’s current, typically disequilibrium, state [YJ,EIJ] has replaced its optimal state [xJ,QIJ] to portray the condition of a model out of stasis. We must also imagine the z’s of the sectors represented to also be suboptimal. When out of equilibrium, the cost and value data for a commodity J will present themselves as data points that are not yet resolved to a single price ray. And clearly the ‘best visual fit’ will have the price ray controlled by the data most distant from the origin — this in analogy to the condition of more financially powerful sectors having the greater weight in asserting the importance of their valuations to general price determination.
The dynamic of economic adjustment can be envisioned as the economic sectors adjusting their operations so as to align their valuations with the price ray’s slope. Thus the data in our diagram above are constantly moving toward the current price ray that is their resultant; while the ray itself changes slope in response to the adjustment process. (And we must not forget that a proper theory of economics must actuate such a process as continually occurring for each commodity in response to all prices.)
A formal method for determining the price ray’s slope PJ is suggested by the ordinary least squares technique. The OLSQ formulation for eliciting the price ray’s slope would be:
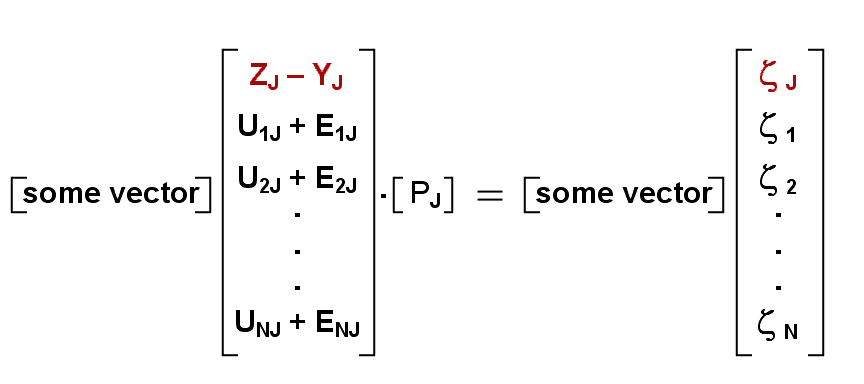
Here the unknown consensus of value PJ has been embedded in a matrix equation expressing the data to be honored; but the instrumental variables needed for solution of this system are left to be specified.
If OLSQ criteria applied fully to this problem, then some vector in the equation above would be supplied by transposing the coefficients vector multiplying PJ. OLSQ criteria are, however, not quite satisfactory for this problem because 1) elements of the abscissa are not known with precision, and 2) the minimization of vertical errors from the regression line is not as desirable as minimizing errors occurring orthogonally to the regression line.
These novel criteria offer great latitude in choosing the instrumental variables with which to replace some vector in our regression; and once again we are guided by our continuing resolve to adopt the simplest formulation that has served the intentionally primitive Model 0. So, until more demanding criteria impose themselves on our project, the some vector of the regression formula will be supplied by the appropriate number of unitary values, i.e. by [1 1 1 ... 1].
When this substitution is made in our matrix formulation, PJ is disclosed according to our ratio/sum technique:
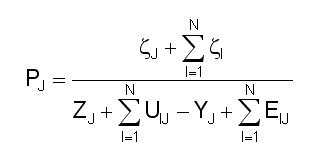
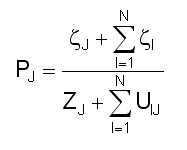
Noting that output YJ must equal the sum of asset usages EIJ at equilibrium, and that these variables therefore cancel in the above, we arrive at the following estimate for a commodity J’s price PJ at equilibrium:
Finally, we must note that our treatment of supply/demand relations stops well short of a complete theory of prices. While the utility parameters [ZJ,UIJ] in the above have solid references and are measurable, the financial discriminants z have yet to be made concrete. At this point, all we know is that a sector’s z can be calculated by many paths when the economy is in stasis, and that calculations of z, b, and q produce different results when the economy is out of equilibrium. Completion of Model 0 will require references to each of z’s approaches in order to finally arrive at a definition of cardinal prices to guide the dynamic by which economic stasis arrives.