This study was based on public data from the UK’s Office of National Statistics ONS. In 2004 the ONS recast its eleven input/output tables from 1992 to 2002 for the sake of a consistently-applied methodology throughout a fairly extensive period. National accounts tend to be indifferently defined from year to year; so the ONS presentation had already overcome one of the main barriers to performing (as well as to accepting) longitudinal studies on the parameters controlling matrix presentations of economic order.
Other barriers of course remained. National accounts are not created so as to comport with the matrix structure upon which SFEcon’s causality operates. Their definitions of commodities and sectors are sometimes contra-indicated by considerations of what we see as essential to our theory’s operation. And these data are carried in currency units, where SFEcon’s utility parameters are measured in the commodities’ physical units.
Our analysts did what was necessary to cast these particular data into the form required for an application of SFEcon’s notions about utility’s governance of the exchanges EIJ of sectors I regarding commodities J. As detailed in their description of the primitive data and transformations thereupon, the result has its flaws — these being inevitable given that SFEcon’s causality has never been a consideration in designing anyone’s national accounts.
Consistently-defined UK exchange matrices EIJ of order 12x12 were nonetheless generated for each of the eleven years from 1992 to 2002. Our software was used to compute a corresponding utility matrix UIJ for each year under the naïve assumption that the antecedent exchange matrices EIJ all expressed a general optimum at their respective current prices.
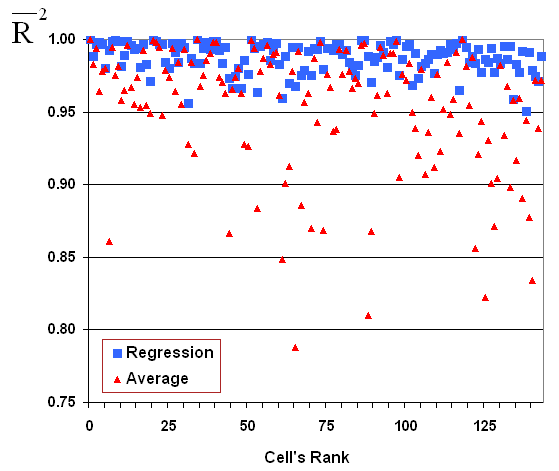
Focus then shifted to individual cells in the matrix formulation. Cells were identified by their rank in an ordering of cells according to the amount of activity occurring therein. Cell 0 recorded the most activity over the eleven years examined; cell 143 recorded the least. An eleven-year time series was developed for each of the 144 parameters in the utility matrix UIJ; and they were all analyzed separately for temporal consistency.
Two models of consistency were applied to each of the 144 series. The first was a simple average, testing the premise that utility parameters should be constant. The second was an OLSQ regression against time, testing the premise that utility parameters should change monotonically. An R-bar-squared was computed for both models of all 144 series, and the results were tabulated in the figure below.

While this experiment was based on what are likely the best data available to the public, its results can be endlessly equivocated on the ground that the necessary initial transformations on the primitive data have legitimate alternatives that have not been investigated; or that the time-series evaluated are rather short; or the data are from one nation enmeshed in significant foreign exchange, said nation having a somewhat overbearing public sector, etc., etc.
But experiments are most properly undertaken with the intention of disproving, rather than proving, a hypothesis. All that can be said of this investigation is that it leaves standing our hypotheses that 1) economic order ensues from a tendency for marginal revenues to approach marginal costs, and 2) hyperbolic utility parameters adequately measure the economy’s underlying technical potential.
We are not above suggesting that, if hyperbolic production parameters were meaningless, this experiment would likely have revealed the fact. And we cannot help but note this experiment to be utterly destructive of the Leontief parameters used in heterodoxy’s CGE modeling.